
Wednesday, October 9, 2024

Tuesday, October 8, 2024
Wednesday, April 17, 2024
Java Serial Class that works with Numato Labs USB I/O device.
This product is interesting because it is relatively cheap and does not require special software or drivers. If you have an old PC laying around, you can install Linux Mint on it for free and use this instead of spending the cash on a Raspberry Pi. I did just that to solve a minor problem at our manufacturing facility. We have a warning light that goes off in our clean room which indicates that the particle count is out of specification. The problem was, the employees did not have any sort of timer telling them how long it has been active. After wiring this in parallel to the warning light, I created a Java application that pops up a warning label and a timer. After 3 minutes they must immediately shut down. An alternative to Java would be Python and the tkinter library, which I initially tried. I find it much easier to make nicer graphics in Java. By the time you buy a Raspberry PI 5 and all the required accessories, you might as well find yourself a bare bones mini PC.

package alarm_monitor;

import com.fazecast.jSerialComm.SerialPort;
import java.io.InputStream;
import java.io.OutputStream;
import java.util.logging.Level;
import java.util.logging.Logger;

public final class mySerialPort {

    private SerialPort port;

    public mySerialPort() {
        connect();
    }

    public boolean connect() {
        SerialPort[] ports = SerialPort.getCommPorts();

        if (ports.length > 0) {
            for (SerialPort port1 : ports) {
                if (port1.getDescriptivePortName().equals("Numato Lab 8 Channel USB GPIO Module")) {
                    port = port1;
                }
            }
            if (port != null) {
                port.setBaudRate(19200);
                port.setNumDataBits(8);
                port.setNumStopBits(SerialPort.ONE_STOP_BIT);
                port.setParity(SerialPort.NO_PARITY);
                port.setFlowControl(SerialPort.FLOW_CONTROL_DISABLED);
                port.setComPortTimeouts(SerialPort.TIMEOUT_NONBLOCKING, 250, 250);
                return true;
            }
        }
        return false;
    }

    public void close() {
        if (port != null) {
            port.closePort();
        }
    }

    public String getPortInfo() {
        StringBuilder sb = new StringBuilder();
        for (SerialPort myPorts : SerialPort.getCommPorts()) {
            sb.append(port.getSystemPortPath()).append(": ").append(myPorts.getDescriptivePortName()).append("\n");
        }
        return sb.toString();
    }

    public boolean isOpen() {
        if (port != null) {
            return port.isOpen();
        } else {
            return false;
        }
    }

    public int getAlarmStatus() {

        String dataToWrite;

        try {
            OutputStream outputStream;
            int[] intData;
            try (InputStream inputStream = port.getInputStream()) {
                outputStream = port.getOutputStream();
                port.openPort();
                dataToWrite = "gpio set 0\r";
                outputStream.write(dataToWrite.getBytes());
                outputStream.flush();
                Thread.sleep(200);
                byte[] inputBuffer = new byte[inputStream.available()];
                inputStream.read(inputBuffer);
                dataToWrite = "gpio read 1\r";
                outputStream.write(dataToWrite.getBytes());
                outputStream.flush();
                Thread.sleep(200);
                inputBuffer = new byte[inputStream.available()];
                int bytesRead = inputStream.read(inputBuffer);
                intData = new int[bytesRead];
                for (int i = 0; i < bytesRead; i++) {
                    intData[i] = inputBuffer[i] & 0xFF;
                }
            }
            outputStream.close();
            port.closePort();

            return intData[13] - 48;

        } catch (Exception ex) {
            Logger.getLogger(mySerialPort.class.getName()).log(Level.SEVERE, null, ex);
            return -1;
        }
    }


Wednesday, March 6, 2024
HMI and controls to test consumable copy machine part
This machine tests several key quality parameters for a consumable part for copy machines. This particular part consists of 8 very small diameter wires, only a few thousands of an inch diameter, that are placed on a plastic frame with a Fanuc robot. There are two groups of four wires, like a very tiny guitar. The spacing and tension on the wires are critical and this test machine verifies the key parameters are in tolerance. It also saves production data to an SQL file. Here is a link to the GUI I created and another link to the consumable Part being testing in the machine. The GUI made it easier to troubleshoot the process, since it provided a graphical representation of the frequency response of each wire and a clear pass/fail diagram for the operator.
Friday, February 9, 2024
Small Control Cabinet with Productivity 1000 PLC
I created this control cabinet to interface a 100 ton Trane chiller and four pumps to a pure steam generator and collect water and nitrogen usage data. Our Niagara BMS polls this processor for data using ModbusTCP.


Saturday, December 24, 2022


Thursday, December 15, 2022
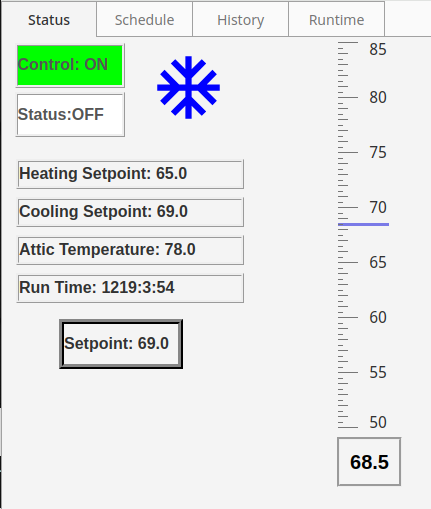
Python program to communicate with a wireless BACnet thermostat.

The thermostat is a BAST-221C-BW2 from Contemporary Controls and the cost is very reasonable at $160. This version is wireless which is ideal for home use. The thermostat does not come with a weekly schedule function since it was made primarily for industrial applications where this would be handled by a building management system.
The program reads the following parameters from the thermostat one time each minute: currentTemperature, activeTemperatureSetpoint, coolingTemperatureSetpoint, heatingTemperatureSetpoint, coolingHeatingStatus, relayStatus1, relayStatus3, relayStatus7, fanStatus. It then stores the data in a SQLITE3 database which is open source. I used SQLITE STUDIO to query the data.
The program is running on a Dell laptop running Linux Mint.

Tuesday, November 22, 2022
OG&E Energy Savings Rebate $194,839.27
I earned a $194k rebate from OG&E for my former employer in Yukon, OK. The project involved the specification and installation of a correctly sized air compressor and dryer. At the award ceremony I was told that it was the second largest rebate ever awarded in Oklahoma.
Thursday, August 4, 2022
Historical trends via Canary Labs and Axiom trending. The extruder is running great since the retrofit. Shown in the chart are two independent sources for extruder speed. Percent current is also displayed which is proportional to extruder pressure. The characteristic sawtooth wave of the two gravimetric feeders is also shown. The key metric is melt flow index but the value can only be obtained at twenty minute intervals due to limitations in the lab process.

Monday, August 1, 2022


It's hard to believe that a major manufacturing company is still using PLC-5's in 2022 but we were. I recently upgraded this entire system to a new controller. The heart of the process is a Werner & Pfleiderer twin screw extruder (400hp). The DCS also controls a material vacuum convey system with three independent vacuum pumps. Resin powder is transferred from bags to various hoppers and then to a third floor mixer. The mixer prepares batches by dosing an additive via a Coriolis meter. The batch gets mixed with pure resin with two KTron gravimetric feeders then fed to the extruder inlet. Twelve heated (and water cooled) zones on the extruder manage the temperature of the reaction with independent PID loops. The finished material gets flattened with nip rolls, solidified on a water cooled belt cooler and turned into powder through a pin mill and hammer mill. The final step is vacuum conveyed into finish product on RiceLake weigh scales.


Saturday, July 30, 2022
Quality Inspection Machine
This machine inspects the quality of an assembly consisting of a plastic frame and a long strand of very thin wire that has been placed in specific slots and tensioned just the right amount with a Fanuc robot. The final assembly resembles a tiny guitar with four strings on one side and four strings on the other side. This guitar wouldn't play any interesting songs because all the wires are "tuned" to the same frequency. The wires are only a few thousands of an inch thick and they have a very thin glass coating that acts like an insulator. The operation of the machine can be seen in this video, Precision Part Inspection Machine and the corresponding graphical user interface can be viewed here, Precision Part Inspection GUI.
The key elements of the machine are the Keyence optical micrometer and high speed DAQ unit. The moving parts of the machine are controlled by an AutomationDirect PLC and I created a custom GUI in C# for the operator interface. The C# GUI interfaces with the PLC and the DAQ unit. The GUI reads the raw data from the DAQ card and calculates the key parameter which is the frequency of vibration. The RMS value is also calculated to determine the validity of the measurement. Daily totals are displayed in a table and data is also stored in an SQL database.
Thursday, March 24, 2022
Torit Vacuum Dust Collector Upgraded Controls
Troubleshooting the original system was a nightmare because of the unorganized and dirty cabinet, lack of documentation, and obsolete controls.

System upgraded with Allen Bradley Micrologix 1400 PLC and Red Lion Graphite HMI


Monday, November 1, 2021
Monday, January 4, 2021
Use Python to create a mixed sinusoidal signal and determine fundamental frequencies with fft
from numpy.fft import fft
import numpy as np
import matplotlib.pyplot as plt
from matplotlib.ticker import (MultipleLocator, AutoMinorLocator)
signalFrequency1 = 550
signalFrequency2 = 650
signalFrequency3 = 750
sampleFrequency = 20000
numberOfSamples = 2000
samplingInterval = 1 / sampleFrequency
endTime = numberOfSamples/sampleFrequency
timeAxis=np.arange(0, endTime, samplingInterval)
frequencyAxis = np.arange(0, sampleFrequency, 1/endTime)
signal1 = np.sin(2*np.pi*signalFrequency1*timeAxis)
signal1 = 10*signal1;
signal2 = np.sin(2*np.pi*signalFrequency2*timeAxis)
signal2 = 5*signal2;
signal3 = np.sin(2*np.pi*signalFrequency3*timeAxis)
signal3 = 2*signal3;
compositeSignal = signal1 + signal2 + signal3
transform = fft(compositeSignal)
fig1 = plt.figure(figsize=(15,4))
plt.plot(timeAxis, compositeSignal)
fig2, ax = plt.subplots(figsize=(15,3))
ax.bar(frequencyAxis[50:80], abs(transform)[50:80], width=2)
ax.xaxis.set_minor_locator(AutoMinorLocator())
ax.tick_params(which='both', width=2)
ax.tick_params(which='major', length=10)
ax.tick_params(which='minor', length=5, color='gray')
ax.xaxis.set_minor_locator(MultipleLocator(10))
ax.xaxis.set_major_locator(MultipleLocator(50))
plt.show()
plt.savefig('fft.png')

Thursday, December 31, 2020
Data acquisition from a Dataq Instruments DI-2108 with Python
This program is broken into two parts and I am using Jupyter lab. The first cell handles establishing the serial connection and setting parameters on the DAQ. The second part handles the data collection.
import serialimport serial.tools.list_ports
import time
"""
for Dataq model DI-2108
0x0000 = Analog channel 0, ±10 V range
0x0001 = Analog channel 1, ±10 V range
srate min = 375
srate max = 65535
dec min = 1
dec max = 512
deca min = 1
deca max = 40,000
dividend = 60,000,000
sample rate (hz) = dividend / (srate * dec * deca)
"""
decimation = 1
srate = 3000
dividend = 60000000
sampleRate = dividend / (decimation * srate)
samplePoints = 500
#for analog channel 0 and 1
slist = [0x0000, 0x0001]
analog_ranges = [10]
serialPort=serial.Serial()
def discover():
available_ports = list(serial.tools.list_ports.comports())
hooked_port = ""
for p in available_ports:
# Do we have a DATAQ Instruments device?
if ("VID:PID=0683" in p.hwid):
hooked_port = p.device
break
if hooked_port:
print("Found a DATAQ Instruments device on",hooked_port)
serialPort.timeout = 0
serialPort.port = hooked_port
serialPort.baudrate = '115200'
serialPort.open()
return True
else:
print("Please connect a DATAQ Instruments device")
return False
def send_cmd(command):
serialPort.write((command+'\r').encode())
time.sleep(.01)
if discover():
send_cmd("stop")
send_cmd("encode 0")
send_cmd("ps 0")
send_cmd("slist "+ str(0) + " " + str(0))
send_cmd("slist "+ str(1) + " " + str(1))
send_cmd("dec " + str(decimation))
send_cmd("srate " + str(srate))
print("sample rate = ", sampleRate)
serialPort.close()
The second part of the program handles the data collection. In this example the first two analog channels have a ~500khz signal. I reversed the polarity on channel 2 so it is inverted. The program collects 500 data points and the frequency is calculated using Numpy and the fft library. Since this is not a mixed signal and there is only one fundamental frequency, a fast fourier transform is not the most efficient tool. Since the signal is centered about zero the crossing values can be found with linear interpolation. The crossing values are plotted and the frequency can be found from the slope of this line using Numpy polyfit.

import serial
import serial.tools.list_ports
import matplotlib
import matplotlib.pyplot as plt
from matplotlib.ticker import (MultipleLocator, AutoMinorLocator)
import numpy as np
from numpy.fft import fft
import time
samplePoints = 500
serialPort.open()
data1 = []
data2 = []
count = 0
serialPort.reset_input_buffer()
send_cmd("start")
while(serialPort.inWaiting() < 4):
pass
while (count < samplePoints+10):
data1.append(int.from_bytes(serialPort.read(2), byteorder='little', signed=True))
data2.append(int.from_bytes(serialPort.read(2), byteorder='little', signed=True))
#data2.append(data1[count])
count+=1
send_cmd("stop")
serialPort.close()
for badData in range(10):
data1.pop(0)
data2.pop(0)
scaledData1=[]
scaledData2=[]
for number in data1:
scaledData1.append(10 * number / 32768)
for number in data2:
scaledData2.append(10 * number / 32768)
time=[]
xAxis = np.arange(0, len(data1))
for value in xAxis:
time.append(value/sampleRate)
fig, ax = plt.subplots(6)
fig.set_size_inches(16, 20)
ax[0].plot(time,scaledData1, linewidth=1, color = 'b', marker='o',ms = 4, markeredgecolor='k')
ax[1].plot(time,scaledData2, linewidth=1, color = 'b', marker='o',ms = 4, markeredgecolor='k')
transform1 = fft(scaledData1)
transform2 = fft(scaledData2)
endTime = len(time) / sampleRate
frequencyAxis = np.arange(0, sampleRate, 1/endTime)
partialSample = int(samplePoints/8)
ax[2].bar(frequencyAxis[0:partialSample],abs(transform1)[0:partialSample], width = 10)
ax[2].xaxis.set_minor_locator(AutoMinorLocator())
ax[2].tick_params(which='both', width=2)
ax[2].tick_params(which='major', length=10)
ax[2].tick_params(which='minor', length=5, color='gray')
ax[2].xaxis.set_minor_locator(MultipleLocator(25))
ax[2].xaxis.set_major_locator(MultipleLocator(250))
ax[3].bar(frequencyAxis[0:partialSample],abs(transform2)[0:partialSample], width = 10)
ax[3].xaxis.set_minor_locator(AutoMinorLocator())
ax[3].tick_params(which='both', width=2)
ax[3].tick_params(which='major', length=10)
ax[3].tick_params(which='minor', length=5, color='gray')
ax[3].xaxis.set_minor_locator(MultipleLocator(25))
ax[3].xaxis.set_major_locator(MultipleLocator(250))
def interpolate(x1,x3,y1,y2,y3):
x2 = x1 + (x3-x1) * (y2-y1) / (y3-y1)
return x2
crossingValuesList1 = []
for index in range(len(data1)-1):
if data1[index] * data1[index+1] < 1:
crossingValuesList1.append(interpolate(time[index], time[index+1], data1[index], 0, data1[index+1]))
ax[4].plot(range(0,len(crossingValuesList1)),crossingValuesList1, linewidth=1, color = 'b', marker='o',ms = 4, markeredgecolor='k')
if len(crossingValuesList1) > 0:
frequency1 = .5/(np.polyfit(range(0,len(crossingValuesList1)), crossingValuesList1, 1))[0]
ax[0].scatter(crossingValuesList1, [0] * len(crossingValuesList1), marker='x', s=30, c='red')
crossingValuesList2 = []
for index in range(len(data2)-1):
if (data2[index]) * (data2[index+1]) < 1:
crossingValuesList2.append(interpolate(time[index], time[index+1], data2[index], 0, data2[index+1]))
ax[5].plot(range(0,len(crossingValuesList2)),crossingValuesList2, linewidth=1, color = 'b', marker='o',ms = 4, markeredgecolor='k')
if len(crossingValuesList2) > 0:
frequency2 = .5/(np.polyfit(range(0,len(crossingValuesList2)), crossingValuesList2, 1))[0]
ax[1].scatter(crossingValuesList2, [0] * len(crossingValuesList2), marker='x', s=30, c='red')
print("Frequency 1: ", "{:.1f}".format(frequency1))
print("Frequency 2: ", "{:.1f}".format(frequency2))
plt.savefig('output.png')
plt.show()
serialPort.close()
import serial.tools.list_ports
import matplotlib
import matplotlib.pyplot as plt
from matplotlib.ticker import (MultipleLocator, AutoMinorLocator)
import numpy as np
from numpy.fft import fft
import time
samplePoints = 500
serialPort.open()
data1 = []
data2 = []
count = 0
serialPort.reset_input_buffer()
send_cmd("start")
while(serialPort.inWaiting() < 4):
pass
while (count < samplePoints+10):
data1.append(int.from_bytes(serialPort.read(2), byteorder='little', signed=True))
data2.append(int.from_bytes(serialPort.read(2), byteorder='little', signed=True))
#data2.append(data1[count])
count+=1
send_cmd("stop")
serialPort.close()
for badData in range(10):
data1.pop(0)
data2.pop(0)
scaledData1=[]
scaledData2=[]
for number in data1:
scaledData1.append(10 * number / 32768)
for number in data2:
scaledData2.append(10 * number / 32768)
time=[]
xAxis = np.arange(0, len(data1))
for value in xAxis:
time.append(value/sampleRate)
fig, ax = plt.subplots(6)
fig.set_size_inches(16, 20)
ax[0].plot(time,scaledData1, linewidth=1, color = 'b', marker='o',ms = 4, markeredgecolor='k')
ax[1].plot(time,scaledData2, linewidth=1, color = 'b', marker='o',ms = 4, markeredgecolor='k')
transform1 = fft(scaledData1)
transform2 = fft(scaledData2)
endTime = len(time) / sampleRate
frequencyAxis = np.arange(0, sampleRate, 1/endTime)
partialSample = int(samplePoints/8)
ax[2].bar(frequencyAxis[0:partialSample],abs(transform1)[0:partialSample], width = 10)
ax[2].xaxis.set_minor_locator(AutoMinorLocator())
ax[2].tick_params(which='both', width=2)
ax[2].tick_params(which='major', length=10)
ax[2].tick_params(which='minor', length=5, color='gray')
ax[2].xaxis.set_minor_locator(MultipleLocator(25))
ax[2].xaxis.set_major_locator(MultipleLocator(250))
ax[3].bar(frequencyAxis[0:partialSample],abs(transform2)[0:partialSample], width = 10)
ax[3].xaxis.set_minor_locator(AutoMinorLocator())
ax[3].tick_params(which='both', width=2)
ax[3].tick_params(which='major', length=10)
ax[3].tick_params(which='minor', length=5, color='gray')
ax[3].xaxis.set_minor_locator(MultipleLocator(25))
ax[3].xaxis.set_major_locator(MultipleLocator(250))
def interpolate(x1,x3,y1,y2,y3):
x2 = x1 + (x3-x1) * (y2-y1) / (y3-y1)
return x2
crossingValuesList1 = []
for index in range(len(data1)-1):
if data1[index] * data1[index+1] < 1:
crossingValuesList1.append(interpolate(time[index], time[index+1], data1[index], 0, data1[index+1]))
ax[4].plot(range(0,len(crossingValuesList1)),crossingValuesList1, linewidth=1, color = 'b', marker='o',ms = 4, markeredgecolor='k')
if len(crossingValuesList1) > 0:
frequency1 = .5/(np.polyfit(range(0,len(crossingValuesList1)), crossingValuesList1, 1))[0]
ax[0].scatter(crossingValuesList1, [0] * len(crossingValuesList1), marker='x', s=30, c='red')
crossingValuesList2 = []
for index in range(len(data2)-1):
if (data2[index]) * (data2[index+1]) < 1:
crossingValuesList2.append(interpolate(time[index], time[index+1], data2[index], 0, data2[index+1]))
ax[5].plot(range(0,len(crossingValuesList2)),crossingValuesList2, linewidth=1, color = 'b', marker='o',ms = 4, markeredgecolor='k')
if len(crossingValuesList2) > 0:
frequency2 = .5/(np.polyfit(range(0,len(crossingValuesList2)), crossingValuesList2, 1))[0]
ax[1].scatter(crossingValuesList2, [0] * len(crossingValuesList2), marker='x', s=30, c='red')
print("Frequency 1: ", "{:.1f}".format(frequency1))
print("Frequency 2: ", "{:.1f}".format(frequency2))
plt.savefig('output.png')
plt.show()
serialPort.close()
Create a custom desktop background using Python and Paint.net
First I created a small image using paint.net image editing software. The canvas size of this image is 30x30 pixels. You can create any image you want. I chose this one because I was looking for a simple dark background similar to carbon fiber or treadplate. I have a Seagate external USB drive that had this texture on the outside and I liked the way it looked.

It is a fairly straightforward process to open this image in Python and copy it to fit the resolution of your screen using a two dimensional loop for the rows and columns.

import PIL
from PIL import Image
displayRes = (1920,1080)
black = (0,0,0)
stepSize = 30
treadPlate = Image.open("your_small_image_name.png")
image = PIL.Image.new(mode = "RGB", size = displayRes)
image.paste(black, (0,0,displayRes[0],displayRes[1]))
image.paste(treadPlate, (0,0))
for y in range(0, displayRes[1], stepSize):
for x in range(0, displayRes[0], stepSize):
image.paste(treadPlate, (x,y))
image.save("Background1.png","PNG", quality=100)
print(image.format, image.size, image.mode)
display(image)
Subscribe to:
Posts (Atom)